Cashing In on the Crash: My March 2025 Short Strategy

Table of Contents
I closed the introduction to my February 2025 fund performance update with a quote from the great trader, Jesse Livermore:
There is a time to go long, a time to go short, and a time to go fishing.
Late-February and the majority of March turned out to be fishing season — I didn’t place a single trade during the month of March until the very end.
Instead, I sat on the bank, patiently watching the water, waiting for just the right moment.
That patience paid off in a spectacular way when the market finally showed its hand in late March, allowing me to open several short positions just days before what can only be described as a market bloodbath in early April.
The result? A 6.46% outperformance versus the S&P 500 for March, and a jaw-dropping 20.69% outperformance for the first week of April.
Performance numbers that validate patience #
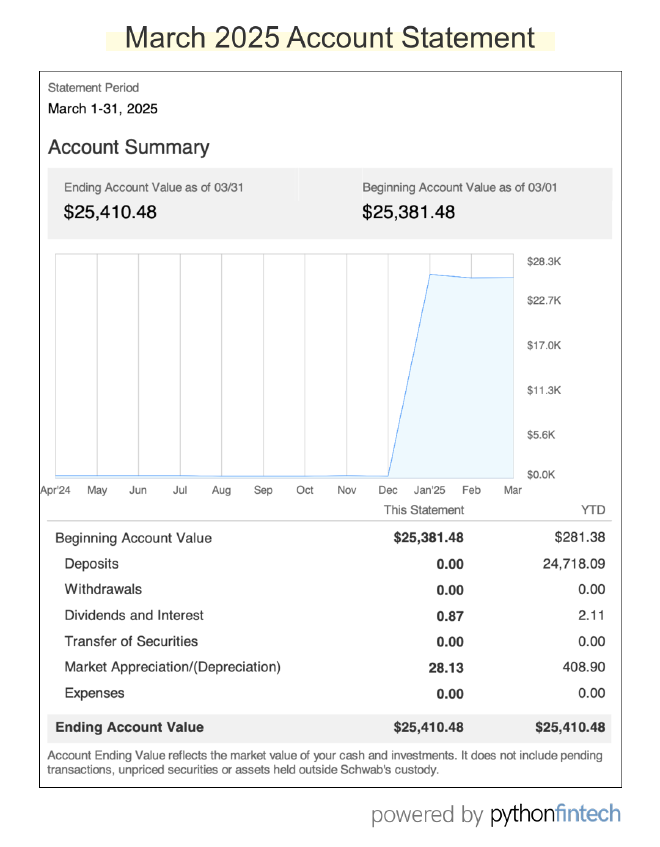
Let’s break down the numbers.
March 2025 performance #
- S&P 500: -4.82%
- My fund: +1.64%
- Outperformance: +6.46%
Early April performance (as of April 8th) #
- S&P 500: -15.27%
- My fund: +5.69%
- Outperformance: +20.69%
At first glance, my end-of-March stats don’t look overly impressive given the number of positions I opened. But then you have to factor in that the market didn’t have its first massive drop until Thursday, April 3rd, with the crushing drop happening on Friday.
Most of the real gains came in the first week of April as my short thesis played out exactly as anticipated.
The outperformance didn’t happen by accident. It was the result of:
- Going to cash in February (preserving capital)
- Waiting patiently for clear technical confluence (managing FOMO, which certainly wasn’t easy)
- Having the conviction to open short positions at precisely the right moment
- Properly sizing those positions to manage risk in a volatile environment
The waiting game and the trigger point #
I spent most of March doing absolutely nothing.
- No trades
- No frantic chart-checking
- No obsessing over every tick in the market
This wasn’t laziness — it was deliberate. I was waiting for a technical setup that would confirm my bearish thesis before committing capital.
The market finally gave me what I was looking for on March 26-27th.
Here’s what happened:
- SPY approached its daily 200MA from below on low volume (bearish)
- This created a confluence with the middle Bollinger Band and weekly 40MA
- Price was firmly rejected from this confluence zone
When I saw this setup, I knew it was time to act.
Within 48 hours, I opened a number of short positions:
- SPY (S&P 500) — 0.25% risk
- QQQ (NASDAQ 100) — 0.25% risk
- TXT (Textron Inc) — 0.1% risk
- SLB (Schlumberger NV) — 0.25% risk
- HIG (Hartford Insurance Group Inc) — 0.5% risk
- LII (Lennox International Inc) — 0.5% risk
- OXY (Occidental Petroleum Corp) — 0.75% risk
- ACGL (Arch Capital Group Ltd) — 0.5% risk
- MMC (Marsh & McLennan Companies Inc) — 0.5% risk
- ROL (Rollins Inc) — 0.5% risk
Notice how I sized these positions smaller than my usual 1% risk per trade.
This was deliberate — I have less experience with short positions than long positions, and I wanted to account for the increased volatility that typically accompanies market corrections.
And, not to mention, I didn’t want to lose my shirt as I was gaining deeper, more intimate experience with shorts.
This proved to be one of the best decisions I made.
Not only did it protect my capital during the initial volatile swings, but it allowed me to stay emotionally detached as the trades developed, allowing me to still sleep as night.
Furthermore, not all of these shorts worked out, I was stopped out of a view of them (including MMC, ROL, and HIG).
But the others I was able to let run…and win big.
Technical analysis that confirmed the bearish thesis #
Let’s break down the technical analysis that gave me confidence to open these short positions.
Daily chart: The perfect rejection #
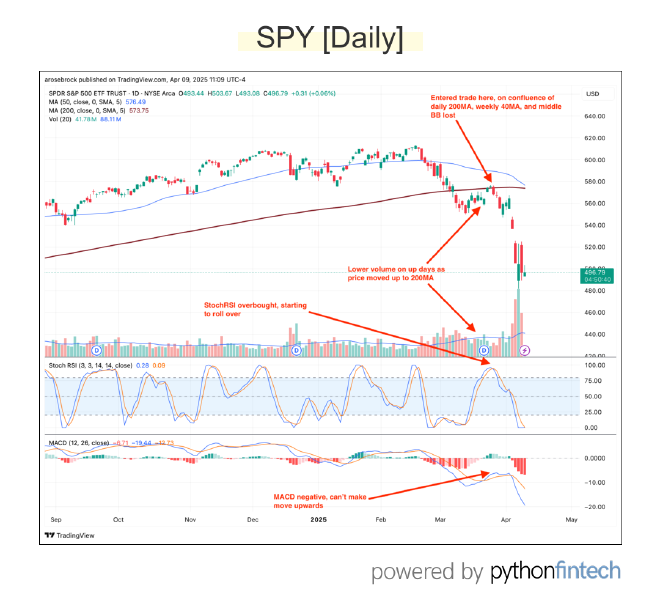
On the daily timeframe, SPY had been attempting to rally back to its 200-day moving average after losing it in late February. This is a common pattern during corrections — markets often try to reclaim key moving averages before continuing their downtrend.
What made me particularly bearish was:
- Low volume on the rally - Suggesting a lack of conviction from buyers
- Perfect rejection at technical confluence - The daily 200MA, middle Bollinger Band, and weekly 40MA all converged in the same area
Weekly perspective: Death cross brewing #
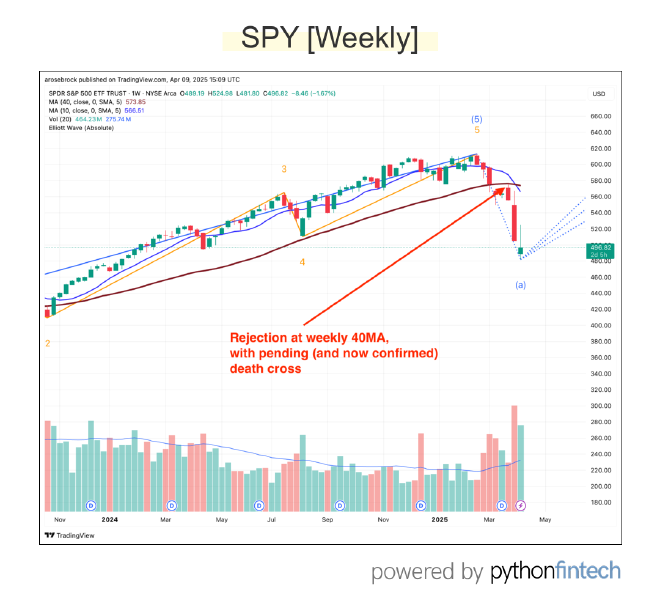
Zooming out to the weekly timeframe revealed an even more concerning picture:
- The weekly 10MA was dropping quickly, setting up to cross the 40MA (i..e, a “death cross”) in the coming weeks
- RSI momentum was falling
- Volume was increasing on down weeks
This type of setup has historically preceded larger corrections (in fact, similar technical patterns occurred before both the 2018 and 2020 corrections).
The weekly chart gave me confidence that what we were seeing wasn’t just short-term noise, but the beginning of a potentially significant corrective phase.
Monthly momentum shift #
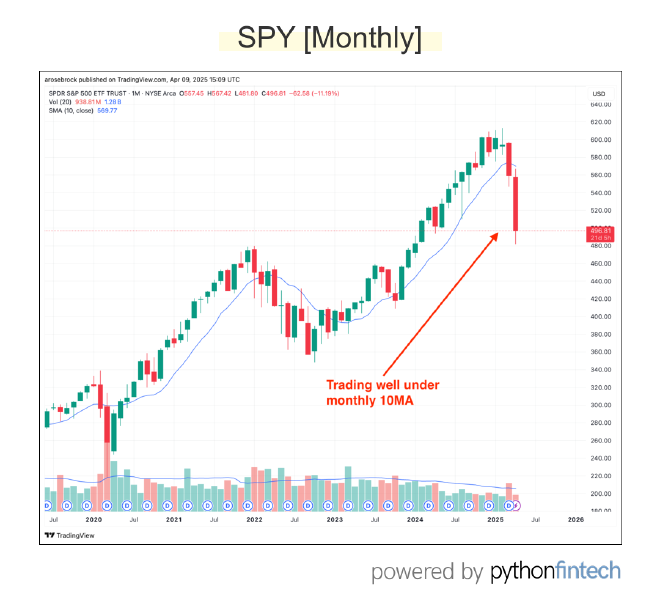
The monthly chart provided the final piece of the puzzle:
SPY lost its monthly 10MA on increased volume.
When you see technical confluence across multiple timeframes (daily, weekly, and monthly), the probability of a significant move increases dramatically.
This multi-timeframe analysis gave me the conviction needed to enter short positions, even though I knew the timing wouldn’t be perfect.
No one rings a bell at market tops or bottoms, but when multiple technical signals align, you increase your odds of being on the right side of the next big move.
Correction or recession? The big question #
The market has now fallen approximately 15-20% from its year-to-date (YTD) high in February.
The immediate question on everyone’s mind — is this just a correction, or the beginning of something more serious?
Here’s my take.
The case for a correction (15-20% drop) #
- This aligns with historical “healthy” corrections during bull markets
- The economy still shows resilience in unemployment rate, interest rate, and inflation (although that could all change, depending on how the tariffs play out)
- The Fed has room to cut rates if necessary
The case for a deeper decline (25-30% or more) #
- The tariff situation is creating significant turmoil, not just in the United States, but worldwide
- Valuation multiples, particularly in tech, had reached extreme levels due to the over-hype and under-deliverability of AI
- Market leaders had been deteriorating for months before the drop
In my view, we’re likely dealing with a significant correction rather than the beginning of a recession.,
However, how the market behaves during the inevitable bounce will tell us much more about what to expect (and I’m never afraid to change my mind).
Bounce scenarios to watch for #
- Successful reclaim of moving averages: If SPY can reclaim its daily 200MA and hold above it on strong volume, this would suggest the correction might be nearing its end.
- Dead cat bounce: A weak rally on low volume that fails at resistance would suggest more downside ahead.
- Elliot Wave pattern completion: If this is an A-B-C corrective pattern, we might see one more push down after the initial bounce.
My current estimate is that we’ll see a bottoming process over the next 4-6 weeks, followed by a gradual recovery, provided tariff drama calms down.
This would align with historical market behavior after similar technical breakdowns.
However, if the tariff drama continues, we could very likely see a dead cat bounce and a proper Elliot Wave decline.
Looking ahead to April #
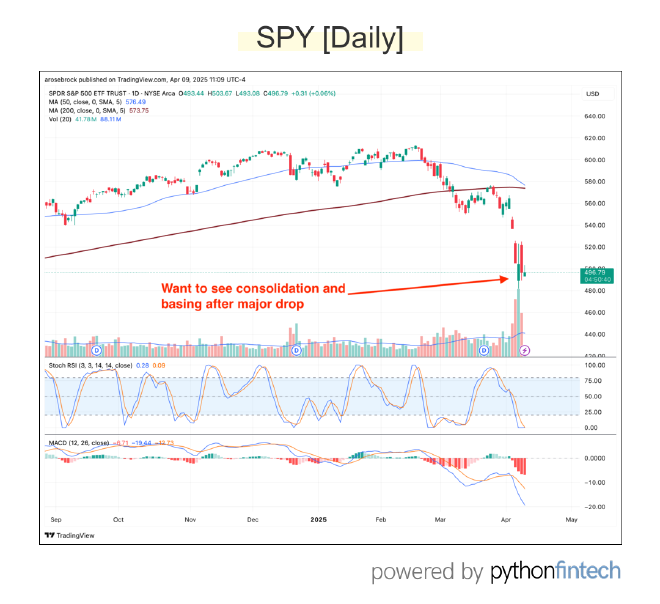
As we move further into April, I’ll be closely watching for:
- Base building: Healthy markets don’t typically V-bottom after significant corrections. I want to see a period of base building before committing significant capital to long positions.
- Volume patterns: Increased volume on up days would suggest institutional accumulation and potential trend change.
- Sector rotation: Which sectors show relative strength during the recovery will tell us a lot about the next market phase.
My position management plan:
- Continue to hold short positions with trailing stops
- Begin taking partial profits as technical targets are reached
- Wait for clear signs of market stabilization before considering new long positions
- Keep at least 50% in cash until a new uptrend is confirmed
Risk management becomes even more critical during volatile market conditions.
I’ll continue using reduced position sizing (0.25-0.75% risk per trade) and tighter stops until volatility subsides.
Final thoughts #
I’m sad for the United States market, as well as the global economy.
But I also feel validated that short positions were correct in terms of market stage development — I called the Stage III to Stage IV transition and I wasn’t afraid to open the positions.
What we’re experiencing is a painful but necessary market reset. Valuations had become stretched, especially in the technology sector, and a correction was overdue.
The key for investors and traders alike is to remember that this too shall pass.
Markets go through cycles, and those who preserve capital during downturns position themselves to capitalize when the inevitable recovery comes.
And if you can short during the downturn, so much the better.
The $25K challenge continues, and while I’m pleased with the recent performance, I’m mindful that markets can humble even the most prepared traders.
Want to follow along? #
Want to stay updated on how I navigate this market correction and position myself for the eventual recovery?
👉 Join my email list for monthly updates on the $25K challenge.
Disclaimer: This is my trading journal, not your personal investment guide. Think of it like watching someone's cooking show — just because I'm making pad thai doesn't mean you should too (especially if you're allergic to peanuts). Sometimes I hold positions in the stocks I write about (shocking, I know). But that doesn't mean you should copy my trades and YOLO your life savings. Do your own research, consult actual professionals, and never trade more than you can afford to lose.