February 2025: How I beat the S&P 500 by 2.87% by going to cash

Table of Contents
In January’s portfolio update, I shared how I managed to outperform the S&P 500 by 0.43% while trading from Taiwan, juggling time zones, and drinking more bubble tea than any human reasonably should.
February ended with what seemed like a marginal outperformance—literally +0.01% over the S&P 500.
Not exactly the stuff of trading legends.
But as market conditions deteriorated in late-February/early-March, my decision to go entirely to cash transformed that hairline advantage into something worth talking about.
As the great Jesse Livermore once said:
There is a time to go long, a time to go short, and a time to go fishing.
Late-February turned out to be fishing season, and I’m glad I packed my tackle box.
My fund performance vs. S&P 500 #
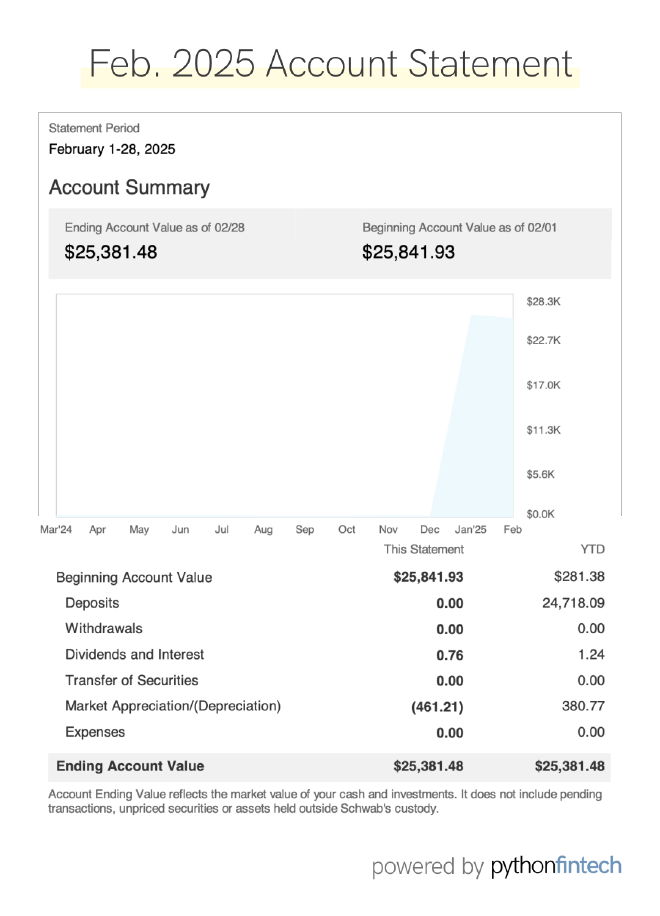
Let’s get to the numbers:
- As of market close February 28, 2025, my fund is up 1.53% while the S&P 500 is up 1.52%
- That’s an outperformance of +0.01% (yes, you read that right—one one-hundredth of a percent)
- My fund dropped 1.78% during the month of February due to market downturn (although I was able to protect myself from the brunt of it — more on that later)
- And, at the end of February, 100% of my account was in cash (i.e., no holdings)
But here’s where it gets interesting:
At the time of writing (March 5, 2025), the S&P 500 is down 1.35%, while my portfolio remains at +1.53% — this means I’m now outperforming the S&P 500 by +2.87%.
This outperformance is particularly meaningful because it demonstrates the value of capital preservation when market conditions deteriorate.
As the saying goes, sometimes winning isn’t about making the most money—it’s about losing the least.
The RSI trade breakdown #
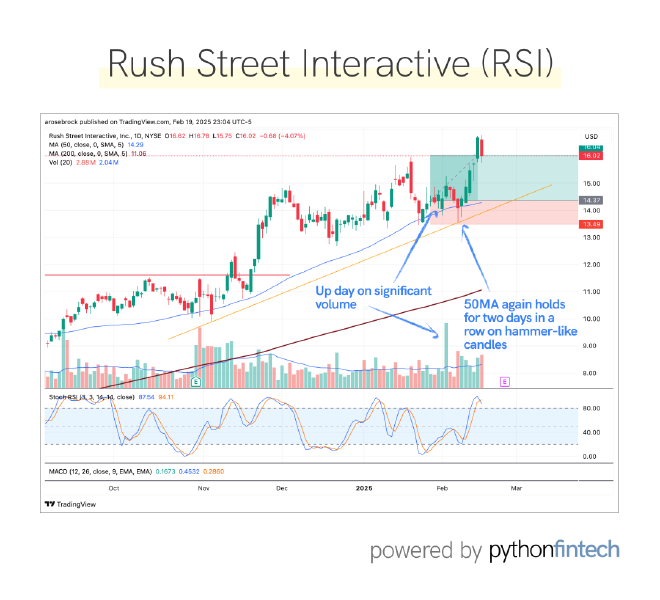
If you’ve been following along, you know I opened a position in Rush Street Interactive (RSI) on January 29th.
The trade initially performed exceptionally well, with the position up approximately 2.6R by mid-February.
The thesis was solid:
- RSI had strong fundamentals
- Was trading above key moving averages
- And had shown resilience during previous market wobbles
I was confident in the trade and believed it would continue higher, especially with quarterly earnings and revenue announcements on the horizon.
Why didn’t I take partial profits at 2.6R?
Two reasons:
- I genuinely believed the stock would run higher at the quarterly earnings announcement
- I was still in Taiwan, with the US market closing at 5AM local time—the 13-hour time difference made it nearly impossible to monitor the market close consistently
In retrospect, had I been back in the US, I would have taken partial profits. Trading is hard enough without adding the complexity of significant time zone differences.
The market started heading south around February 20th, and I was stopped out of the trade on Friday, February 21st, as I was on my flight back to Toronto (talk about timing).
Since its February 13th high, RSI has plummeted approximately 33% and is now trading just above its daily 200MA.
While I still believe the fundamentals of the stock are solid, there’s truth in what my mentor colorfully says about larger market corrections:
When then cops raid the brothel, they take the piano player too.
Translation: Even companies with strong fundamentals get dragged down during broader market corrections. There’s not much you can do other than respect your stops and preserve capital.
Reading the technical warning signs #
The decision to go entirely to cash wasn’t random or based on a gut feeling.
It was the culmination of multiple technical signals that, when viewed together, painted a clear picture of market weakness.
Here’s what I saw:
- The S&P 500 dropped on significantly (> 5%) higher volume over the course of a week
- Major indices, including SPY, DJI, and QQQ, lost their daily 50MAs
- On the weekly timeframe, the S&P 500 lost its weekly 10MA
- Market leaders like NVDA, AVGO, and PLTR started breaking down below their daily 50MAs
In isolation, any one of these signals might be noise. Together, they told a compelling story: the smart money was heading for the exits.
Volume is particularly telling.
When markets drop on higher volume than they rise, it suggests distribution—institutions selling to retail investors who think they’re “buying the dip.”
I’ve been burned by ignoring volume patterns before and wasn’t about to make that mistake again.
The decision point came when I saw multiple market leaders breaking down simultaneously with increasing volume. That’s typically not a one-day event but rather the start of a more significant correction.
Going to cash wasn’t just about avoiding losses—it was about positioning myself to capitalize on better opportunities after the correction runs its course.
Market outlook for March #
Let’s investigate how the market is looking for the rest of March.
(Narrator: Not ain’t good.)
Daily chart perspective #
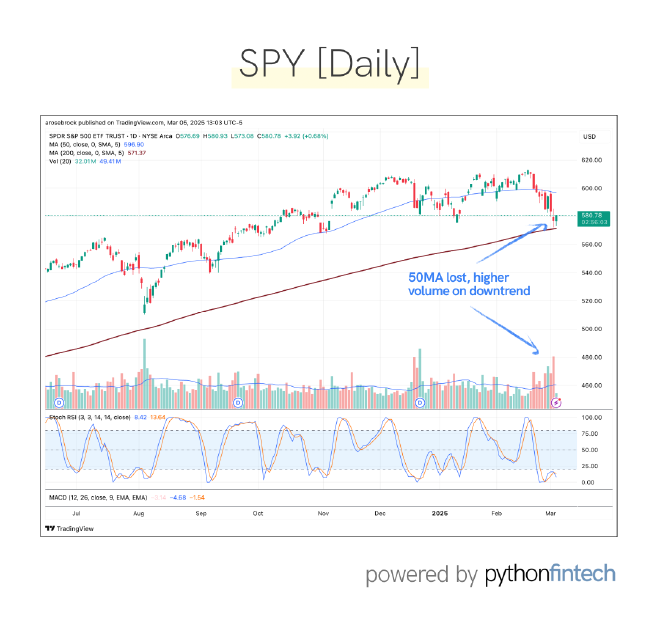
On the daily timeframe, the S&P 500, Dow Jones Industrial Average, and NASDAQ are all trading below their 50-day moving averages while hovering just above their 200-day moving averages.
This is a precarious position. The 200MA represents a major technical support before a more significant breakdown could occur. If the indices lose their 200MAs with conviction (high volume), we could see accelerated selling.
Current volume patterns are concerning. We’re seeing higher-than-average volume on down days and below-average volume on up days—a classic distribution pattern that suggests institutional selling continues.
For the bulls to regain control, we need to see a reversal back above the 50MA with increasing volume.
Until then, the path of least resistance appears to be lower.
Weekly technical analysis #
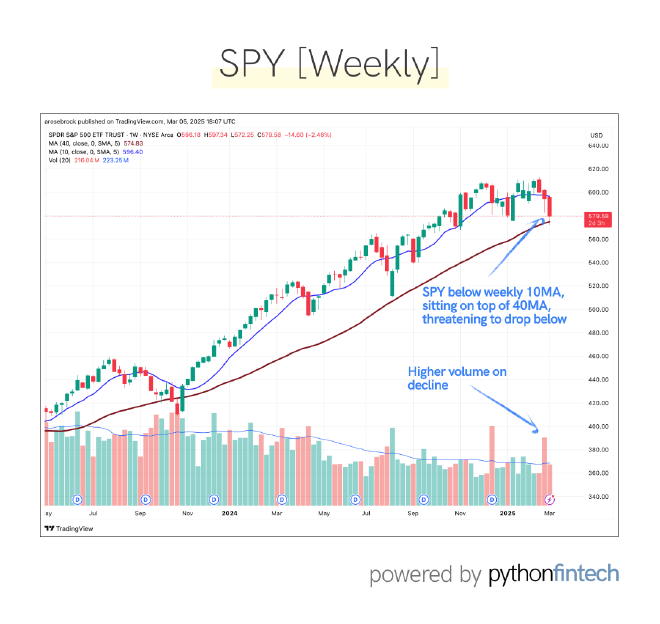
Zooming out to the weekly timeframe provides additional context. All three major indices have lost their weekly 10MAs but are still treading water above their weekly 40MAs.
The loss of the weekly 10MA can be significant—it’s often one of the first signs that a trend change is underway.
During the bull market of 2023-2024, the weekly 10MA acted as support many times. Losing it now, and on higher volume, suggests the character of the market may be changing.
Several momentum indicators are showing bearish divergences on the weekly charts. The RSI (Relative Strength Index) has been making lower highs while price made higher highs—a classic divergence that often precedes significant corrections.
Similar technical setups in 2018 and 2022 led to corrections of 15-20%. While history doesn’t always repeat, it often rhymes, and the current setup is rhyming with previous corrective phases.
Monthly market health check #
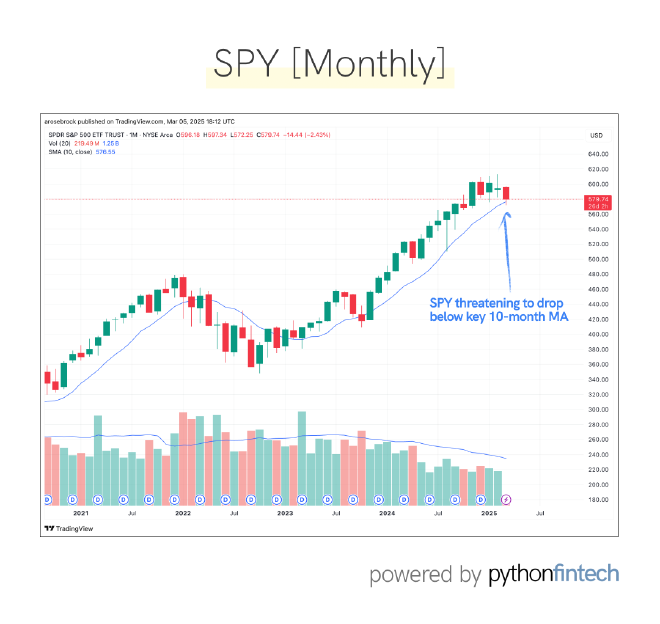
The monthly chart provides the big-picture view, and it’s worth paying attention to.
The S&P 500 is less than 1% away from its monthly 10MA. If this level is lost, it would be a bearish sign for the intermediate-term outlook.
Historically, when the S&P 500 trades below its monthly 10MA, risk increases significantly.
A 2006 study by Mebane Faber suggested a simple and effective strategy for long-term investors is to be long the S&P when it’s above its monthly 10MA and move to cash when it trades below.
This approach has kept investors out of major drawdowns while capturing most of the upside in bull markets.
It’s not perfect (no strategy is), but it provides a mechanical rule that removes emotion from the equation.
The proximity to this critical level suggests we’re at an important juncture for the broader market.
Market leaders under pressure #
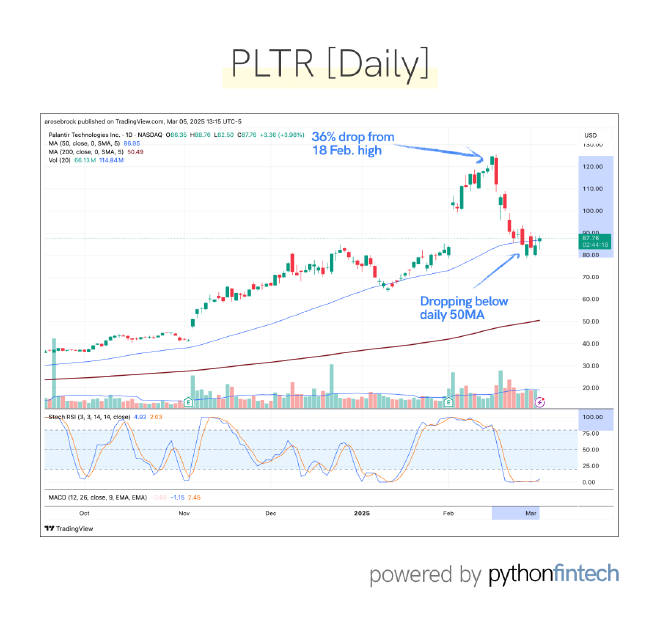
Major market leaders including NVIDIA, Broadcom, Palantir, and Robinhood have started to level off at their daily 50MAs, if not turn downward with significant volume.
Palantir (PLTR), for example, has dropped over 30% from its recent high and is now trading below its daily 50MA with above-average volume. This suggests distribution—institutions selling to retail investors.
NVDA tells a similar story, only its trading below its 200-day MA, despite beating recent quarterly earnings and revenue expectations (a very poor sign for current market health):
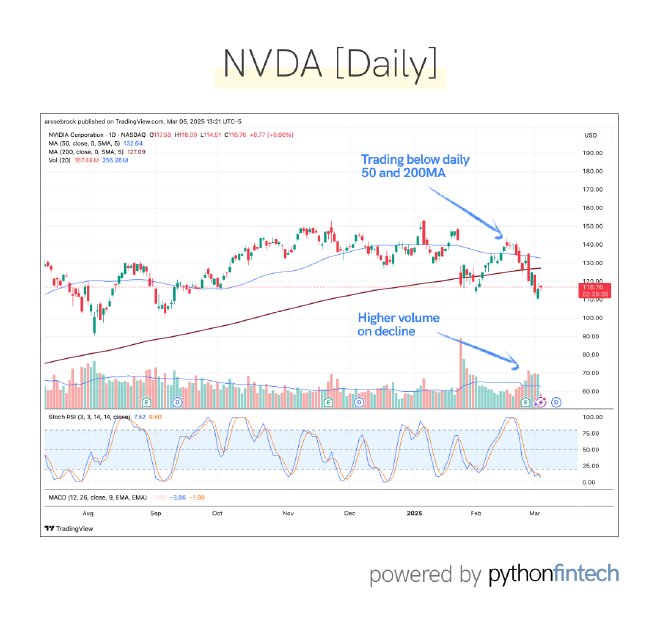
When market leaders falter, it’s often a signal that the broader market is due for a correction. These stocks typically lead in both directions—they lead the market higher during bull phases and lower during corrections.
The high volume on down days implies that institutions are taking profits and moving to cash, likely in anticipation of a larger market pullback.
Macro catalysts #
Beyond the technical picture, there are macro catalysts potentially driving the market weakness.
The market is currently grappling with the thread (and now impact) of Trump’s tariffs on Canada, Mexico, and China.
While the long-term economic effects remain unclear, the immediate reaction has been uncertainty—and markets hate uncertainty.
Many analysts have been predicting a market correction of approximately 15% by the end of the year — the tariff implementation may be the catalyst needed to trigger that drop.
It’s worth noting that a 15% drop isn’t necessarily catastrophic—it’s more likely a healthy correction after an extended bull run than the start of a recession or depression.
Markets don’t go up in a straight line, and periodic corrections shake out weak hands while creating opportunities for patient investors.
Previous corrections of similar magnitude have typically lasted 3-6 months before the primary trend resumed. The key is to preserve capital during the correction so you can deploy it when conditions improve.
My defensive strategy #

Cash is king #
Given the technical and macro picture, I’ve made the decision to go fully to cash.
This isn’t about trying to time the exact bottom—that’s a fool’s errand. It’s about protecting capital while the market sorts itself out. As the saying goes:
He who fights and runs away lives to fight another day.
By preserving capital now, I’m positioning myself to deploy it more effectively when clearer opportunities present themselves.
The opportunity cost of being in cash for a few months is far less than the cost of riding a significant drawdown.
There’s also a psychological advantage to being in cash during market turmoil.
When you’re not watching your positions lose value day after day, you can maintain objectivity and make clearer decisions when it’s time to re-enter the market.
As Jesse Livermore put it:
Money is made by sitting, not trading.
Sometimes the most profitable decision is to do nothing and wait.
Hunting for opportunities #
While I’m content to remain primarily in cash, I’m not completely on the sidelines. I’m actively building a watchlist of potential opportunities for when market conditions improve.
With large-cap and mega-cap stocks showing weakness, I’ve started looking at some mid-cap names that might show relative strength during the correction or lead the recovery when it comes.
However, even with opportunities that I find compelling, I’ll likely only risk 0.25-0.5% per trade rather than my standard 1%.
I let market behavior dictate my position size—in uncertain markets, smaller positions make sense.
My watchlist development focuses on:
- Companies with strong relative strength/performance
- Trading above their daily 200MAs and near/above their daily 50MAs
- Oversold conditions according to the Stochastic RSI indicator
- Consolidation followed by potential breakouts
- Strong earnings/revenue growth, exceeding analyst expectations
- Improving gross and net margins
The goal is to be ready when conditions improve, with a clear plan of action rather than reacting emotionally to market movements.
Final thoughts #
February’s trading experience reinforces a lesson I’ve learned repeatedly: sometimes the best trade is no trade at all.
By recognizing the technical warning signs and moving to cash, I transformed a marginal outperformance of +0.01% into a meaningful edge of +2.87%.
While that might not seem like much in absolute terms, compounded over time, these decisions make the difference between average and exceptional returns.
Sometimes to beat the S&P 500, it’s not about opening more trades—it’s about knowing when to go to cash, and then waiting for opportunities.
As we move further into March, I’ll remain disciplined, patient, and focused on capital preservation. When the market environment improves—and it will—I’ll be ready with dry powder to deploy.
Finally, I’ll add that market corrections are opportunities in disguise. They reset valuations, shake out weak hands, and create favorable entry points for those with the patience to wait for them to unfold.
The key is taking what the market gives you rather than forcing trades in unfavorable conditions. Right now, the market is giving us a correction. The appropriate response is patience and capital preservation.
Follow along #
Want to follow along as I navigate market correction?
👉 Join my email list and I’ll keep you updated on my $25K challenge to beat the S&P 500.
Disclaimer: This is my trading journal, not your personal investment guide. Think of it like watching someone's cooking show — just because I'm making pad thai doesn't mean you should too (especially if you're allergic to peanuts). Sometimes I hold positions in the stocks I write about (shocking, I know). But that doesn't mean you should copy my trades and YOLO your life savings. Do your own research, consult actual professionals, and never trade more than you can afford to lose.